Plotting network data


In this post, we will take a look at plotting network data with matplotlib.
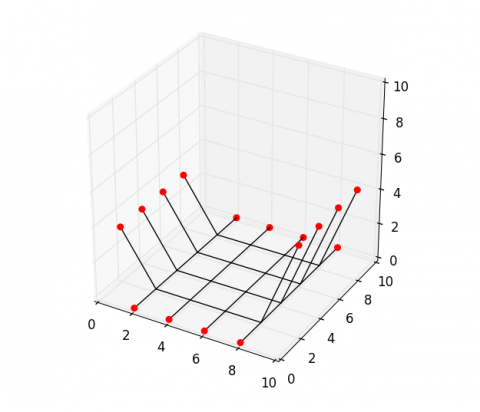
import matplotlib.pyplot as plt
from mpl_toolkits.mplot3d import Axes3D

fig = plt.figure()
ax  = fig.gca(projection='3d')

for u, v in edges:
    ax.plot([vertices[u][0], vertices[v][0]],
           [vertices[u][1], vertices[v][1]],
           [vertices[u][2], vertices[v][2]], color='k')
for i in points:
    ax.scatter(vertices[i][0], vertices[i][1], vertices[i][2],
              color='r', s=30)

ax.scatter([0, 10], [0, 10], [0, 10], color='w', s=1)
ax.set_xlim([0, 10])
ax.set_ylim([0, 10])
ax.set_zlim([0, 10])
ax.set_aspect('equal')
plt.show()