Dynamic relaxation


In previous posts, we described how to read network data from a file and convert it into matrices relevant for structural calculations. Here, we will use the method of dynamic relaxation to compute an equilibrium shape of the provided network data.
from numpy import array, zeros, float64
from scipy.sparse import coo_matrix, diags

# Input data:
# -----------
# vertices: a list of unique xyz coordinates
# edges: a list of pairs of vertex indices
# points: index list of fixed vertices

m = len(edges)
n = len(vertices)

fixed = points
free  = list(set(range(n)) - set(fixed))

data = array([-1]*m + [1]*m)
rows = array(range(m) + range(m))
cols = array(edges).reshape(2*m, order='F')
C    = coo_matrix((data, (rows, cols))).tocsr()
Ci   = C[:, free]
Cit  = Ci.transpose()
Cf   = C[:, fixed]
xyz  = array(vertices)
p    = zeros((n, 3), dtype=float64)
q    = array([1.0 for i in range(m)]).reshape((-1, 1))
Q    = diags([q.flatten()], [0])

v    = zeros((n, 3), dtype=float64)
r    = zeros((n, 3), dtype=float64)
kmax = 1000
dt   = 1.0
mass = 1.0

for k in xrange(kmax):
    xyz0      = xyz.copy()
    v0        = v.copy()
    dx        = v0 * dt
    xyz[free] = xyz0[free] + dx[free]
    r[free]   = p[free] - Cit.dot(Q.dot(C.dot(xyz)))
    a         = 0.1 * r[free] / mass
    dv        = dt * a
    v[free]   = v0[free] + dv
    dx        = v * dt
    xyz[free] = xyz0[free] + dx[free]
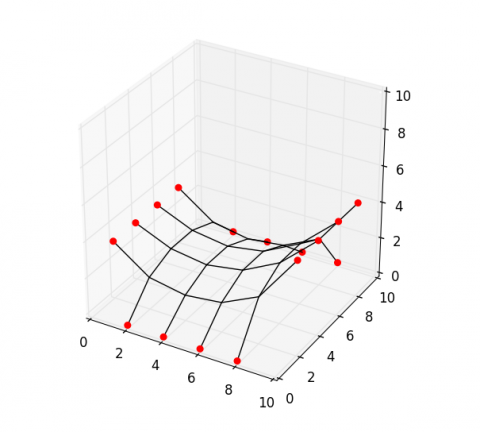
With this file (‘http://block.arch.ethz.ch/labs/samples/saddle.obj’) as input, you should get the following figure of equilibrium. For details on plotting network data, read this post.